August 2015 Hansen & Associates Newsletter
Inflation and Hourly Wage Growth
Wage growth is an important leading metric of consumer behavior, as higher wages increase disposable income, which in turn drives more spending. The chart depicts nominal hourly wage growth and the inflation rate (represented by the consumer price index) since 2010. Both metrics are on a year-over-year basis, and averaged for 3 months in order to smooth out the monthly seasonality.
What really stands out is that nominal hourly wages have been growing at a steady 2% rate for many years now, and they have recently accelerated just slightly to about 2.2%. What contributed to a huge increase in the real wage growth (not shown on the chart), however, was the collapse of the inflation rate that began in the second half of 2014, driven by lower oil and gasoline prices.
This article contains certain forward-looking statements which involve known and unknown risks, uncertainties, and other factors that may cause the actual results to differ materially from any future results expressed or implied by those projected statements. Past performance does not guarantee future results.
[/column][column col=”1/2″]
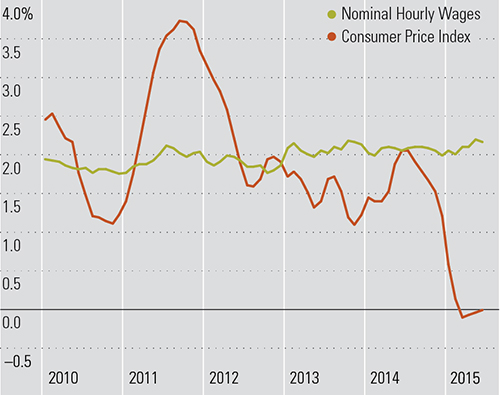
Source: Bureau of Labor Statistics, Morningstar.
[/column]
[space height=”1″]
©2013 Morningstar, Inc., 22 W. Washington Street, Chicago, IL 60602.
Target-Date Funds Post Strong Investor Returns
Target-date funds continue to cement their place as the preferred investment for American workers’ retirement savings. Target-date assets grew to $706 billion by December 31, 2014, according to Morningstar’s 2015 Target-Date Fund Landscape report. Investors pumped $49 billion in net new inflows into the funds last year, representing an 8% organic growth rate. As target-date funds prosper and grow in assets, it’s important to examine whether investors are using these vehicles well and actually participating in the funds’ gains.
Total return measures the percentage change in price for a fund, assuming the investor buys and holds the fund over the entire time period, reinvests distributions, and does not make any additional purchases or sales. Morningstar-calculated investor return, on the other hand, measures how the typical investor in a fund fared over time, incorporating the impact of cash inflows and outflows from purchases and sales. It takes into account the fact that not all of a fund’s investors bought it at the beginning of a period and held it until the end. Therefore, investor return depicts the return earned by a fund’s typical investor.
Comparing investor returns with total returns gives an idea of how well investors have used the funds. For all target-date funds in Morningstar’s database, the news is good. The annualized asset-weighted investor return over the last 10 years through December 2014 stood at 6.1%, 1.1 percentage points higher than the typical target-date fund’s 5.0% gain, suggesting that, on average, target-date fund investors are using the funds effectively. Target-date investors have essentially reaped all of target-date funds’ gains, plus more. That’s largely due to the discipline inherent in regularly setting aside a portion of each paycheck into retirement savings accounts—the predominant means of investing in these funds.
In contrast, when analyzing all open-ended mutual funds in Morningstar’s database, investor return was lower than total return, indicating that investors tend to be poor market timers when not following a systematic contribution plan, and their long-term returns suffer as a result.
[/column][column col=”1/2″]
Disclosure: An investment in a target-date fund is not guaranteed, and you may experience losses, including losses near, at, or after the target date. There is no guarantee that the fund will provide adequate income at and through retirement. Consider the investment objectives, risks, charges, and expenses of the fund carefully before investing.
Target-date funds are sold by prospectus, which can be obtained from your financial professional or the company and which contains complete information, including investment objectives, risks, charges and expenses. Investors should read the prospectus and consider this information carefully before investing or sending money.
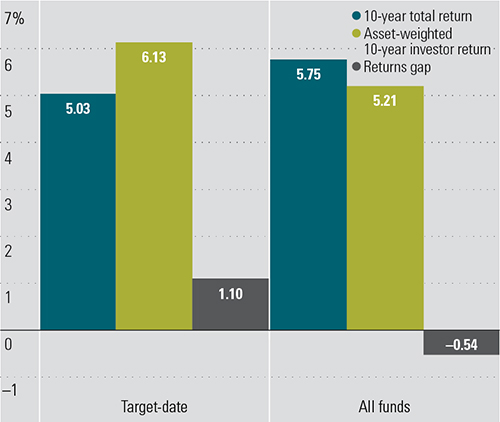
Source: Morningstar 2015 Target Date Fund Landscape report.
Past performance is no guarantee of future results.
[/column]
[space height=”1″]
©2013 Morningstar, Inc., 22 W. Washington Street, Chicago, IL 60602.
[space height=”1″]
Four Retirement-Portfolio Withdrawal Mistakes to Avoid
Some errors in retirement-portfolio planning fall into
the category of minor infractions rather than major missteps. Did you downplay foreign stocks versus standard asset-allocation advice? It’s probably not going to have a big impact on whether your money lasts throughout your retirement years.
But withdrawal rate errors can have more serious repercussions for retirement-portfolios. If you take too much out of your portfolio at the outset of retirement, and that coincides with a difficult market environment
–you can deal your portfolio a blow from which it may never recover. Other retirees may take far less than they actually could, all in the name of safety. The risk is that they didn’t fully enjoy enough of their money during their lifetimes.
Mistake 1: Not Adjusting With Your Portfolio’s Value and Market Conditions. Even though the popular “4% rule” assumes a static annual-dollar-withdrawal amount, adjusted for inflation, retirees would be better off staying flexible with their withdrawals.
What to Do Instead: The simplest way to tether your withdrawal rate to your portfolio’s performance is to withdraw a fixed percentage, versus a fixed dollar amount adjusted for inflation, year in and year out.
That’s intuitively appealing, but this approach may lead to more radical swings in spending than is desirable for many retirees. It’s possible to find a more comfortable middle ground by using a fixed percentage rate as a baseline but bounding those withdrawals with a “ceiling” and “floor.”
Mistake 2: Not Adjusting With Your Time Horizon. Taking a fixed amount from a portfolio also neglects the fact that, as you age, you can safely take more from your portfolio than you could when you were younger. The original “4%” research assumed a 30-year time horizon, but retirees with shorter time horizons (life expectancies) of 10 to 15 years can reasonably take higher amounts.
What to Do Instead: To help factor in the role of life expectancy retirees can use the IRS’ tables for required minimum distributions as a starting point to inform their withdrawal rates. That said, those distribution rates may be too high for people who believe their life expectancy will be longer than average.
[/column][column col=”1/2″]
Mistake 3: Not Adjusting Based on Your Portfolio Mix. Many retirees take withdrawal-rate guidance, such as the 4% guideline, and run with it, without stopping to assess whether their situations fit with the profile underpinning that guidance. The 4% guideline assumed a retiree had a balanced stock/bond portfolio. But retirees with more-conservative portfolios should use a more-conservative (lower) figure, whereas those with more-aggressive asset allocations might reasonably take a higher amount.
What to Do Instead: Be sure to customize your withdrawal rate based on your own factors, including your portfolio mix.
Mistake 4: Not Factoring In the Role of Taxes. The money you’ve saved in tax-deferred retirement-savings vehicles might look comfortingly plump. However, it’s important to factor in taxes when determining your take-home withdrawals from those accounts. A 4% withdrawal from an $800,000 portfolio is $32,000, but that amount shrivels to just $24,000, assuming a 25% tax hit.
What to Do Instead: It pays to be conservative in your planning assumptions. To be safe it’s valuable to assume a higher tax rate than you might actually end up paying.
Disclosure: This is for informational purposes only and should not be considered tax or financial planning advice. Please consult with a financial or tax professional for advice specific to your situation.
This article contributed by Christine Benz, Director of Personal Finance with Morningstar.
[/column]
[space height=”1″]
©2013 Morningstar, Inc., 22 W. Washington Street, Chicago, IL 60602.
Housing Construction in Good Shape
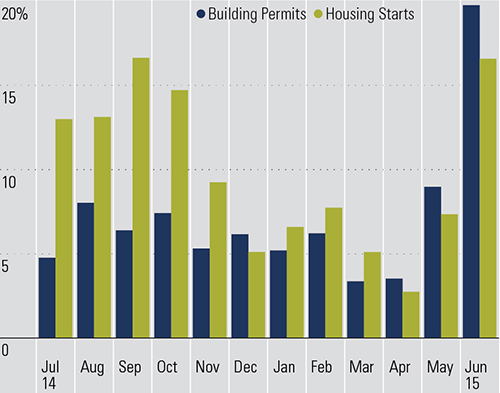
The chart depicts the state of the housing construction industry, suggesting that there is still plenty of room to grow in this slow, but steady recovery we’ve seen so far. The latest starts and permits data from the Census Bureau, however, shows a slightly exaggerated picture, as it is the multi-family category that’s been making overall housing construction look better than it is in reality. Both starts and permits picked up in June, as multi-family activity rose sharply amid expiring construction tax incentives for developers in the New York City area. As a result, the housing construction revival is probably not as strong as the numbers seem to currently suggest. Nonetheless, improvements for single-family construction still look healthy, and continue to trend up closer to the 10% rate year over year.
[/column][column col=”1/2″]
Year-Over-Year Growth, 3-Month Average
[/column]
[space height=”1″]
©2013 Morningstar, Inc., 22 W. Washington Street, Chicago, IL 60602.