Annual Asset Flows
Looking at where investor money is going may provide useful insight into what’s happening in a financial market. The image below illustrates annual flows for U.S. open-end mutual funds, divided by category: U.S. equity funds, international equity funds, and bond funds.
From 2009 to 2012, bond funds received the great majority of money because investors were shying away from equities after the crisis. That trend switched in 2013, as U.S. and international equity categories received strong inflows. In 2014, international equity and bond funds led the way. The trend since 2007 indicates that investors have been moving away from U.S. equity funds. Even though a few years have passed since the end of the crisis, it seems investor confidence is not that easily restored.
The investment return and principal value of mutual funds will fluctuate and shares, when sold, may be worth more or less than their original cost. Mutual funds are sold by prospectus, which can be obtained from your financial professional or the company and which contains complete information, including investment objectives, risks, charges and expenses. Investors should read the prospectus and consider this information carefully before investing or sending money.
Returns and principal invested in stocks are not guaranteed, and stocks have been more volatile than bonds. International investments involve special risks such as fluctuations in currency, foreign taxation, economic and political risks, liquidity risks, and differences in accounting and financial standards.
[/column][column col=”1/2″]
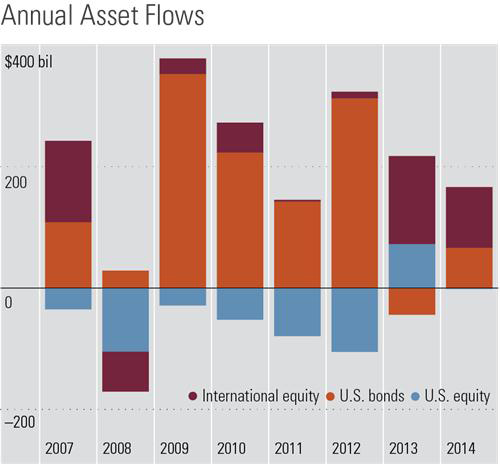
Source: Morningstar Direct. Funds analyzed include U.S. open-end mutual funds. Data as of December 31, 2014.
[/column]
[space height=”1″]
©2013 Morningstar, Inc., 22 W. Washington Street, Chicago, IL 60602.
Dollar-Cost Averaging: It’s Not Just for Stocks
Dollar-cost averaging—the practice of purchasing securities at fixed intervals and in equal amounts over time rather than in one lump sum—has long been used as a way to avoid jumping into the market at the wrong time.
To illustrate how dollar-cost averaging, or DCA, works, consider an investor wishing to buy $10,000 worth of shares of a mutual fund. He could use the lump-sum approach and buy all the shares at once. However, there would be a risk that the market could turn negative shortly thereafter, resulting in an immediate loss on his new investment. Rather than try to determine when the time is right to buy, the investor could ease into the position—for instance, by purchasing $1,000 worth of shares every month for 10 months. That way, if the fund loses value during the time period, less of the investment is exposed to this loss and the investor ends up buying some of the new shares at a lower price than he would have with the lump-sum approach. Of course, if the fund’s shares continue to rise, dollar-cost averaging would impose an opportunity cost compared with the lump-sum approach, which, in hindsight, would have produced better results. But, of course, none of us invests in hindsight.
One of the primary benefits of DCA is that it may reduce volatility when buying securities. Rather than risk a purchase price that’s too high, DCA allows an investor to buy more shares when prices are low and fewer when they are high during a given time period. It also offers investors a system that avoids the challenge of market timing. Even though DCA may not always result in the highest long-term performance, it may be a good strategy for investors jittery about where the market is headed.
DCA is most often mentioned with regard to stock-related purchases, probably because equity markets tend to be far more volatile than bond markets. However, this approach can be used when buying bonds or bond funds, as well. In fact, given the tapering of the Fed’s
[/column][column col=”1/2″]
bond-buying stimulus program and the uncertainty regarding interest rates, which some experts foresee rising some time this year, this might be a good time to use DCA when buying new bonds or bond funds, or if rebalancing a retirement portfolio, to add to existing fixed-income holdings.
One option would be to sell some stock holdings and keep the money in a cash account before dollar-cost averaging into bonds. By putting the money into cash first, equity exposure is reduced in case a market downturn should materialize, and exposure to interest-rate risk is limited by not putting assets all into bonds right away. Instead investors can ease into bonds slowly, so if rates do start to rise and bonds lose value, they can avoid some of those losses while buying more bonds than they would have if they had jumped in with a lump sum.
Given the unpredictable nature of the markets, it’s easy to see why DCA appeals to many investors. It can help reduce volatility and the odds of buyer’s remorse when investing a lump sum at what turns out to be exactly the wrong time.
Returns and principal invested in stocks are not guaranteed. Investing does not ensure a profitable outcome and always involves risk of loss. Dollar-cost averaging does not ensure a profit or protect against a loss in declining markets. Dollar-cost averaging involves continuous investment regardless of fluctuating prices. Investors should consider their financial ability to continue purchases through periods of high price levels. The investment return and principal value of mutual funds will fluctuate and shares, when sold, may be worth more or less than their original cost. Mutual funds are sold by prospectus, which can be obtained from your financial professional or the company and which contains complete information, including investment objectives, risks, charges and expenses. Investors should read the prospectus and consider this information carefully before investing or sending money.
[/column]
[space height=”1″]
©2013 Morningstar, Inc., 22 W. Washington Street, Chicago, IL 60602.
Why Cheap Fund Shares May Not Be a Bargain
Some investors make the mistake of treating a mutual fund’s share price the way they would a stock’s share price, but they’re actually quite different. When considering two mutual funds of comparable quality, choosing the one with the cheapest share price may not be the best way to go.
A stock’s share price represents the market value of one small slice of equity in a company. If the company appears to be growing, demand for its shares may increase because investors expect its earnings (and, thus, its dividends) to grow and/or because they think they will later be able to sell the shares at a higher price. This increased demand for the shares drives the share price higher. If demand decreases–perhaps due to a lousy earnings report or a product recall–its share price is likely to fall.
In contrast, a mutual fund’s share price is determined not by market demand for the shares themselves but rather by the value of the fund’s underlying holdings. This is expressed as the fund’s net asset value, or NAV, meaning the value of all its holdings and cash after expenses are paid divided by the number of shares outstanding. (Also, investors can own fractional shares of mutual funds—something they can’t do with stocks.)
To illustrate, let’s say that the holdings in a fund’s portfolio are worth a combined total of $1 billion after fund expenses are paid, and that the fund has 10 million shares outstanding. Therefore, the net asset value of each of those shares is $100, or $1 billion divided by 10 million.
But what if another fund of comparable quality has a share price of just $75? That’s a much better deal, right?
Not necessarily. Remember that a fund’s share price is determined in part by the number of shares outstanding. So, the lower share price may have nothing to do with the quality of the fund’s holdings and everything to do with the fact that it simply has issued more shares.
[/column][column col=”1/2″]
As an example, let’s say that Fund A has a NAV of $20 per share with 100 million shares outstanding and Fund B has a NAV of $15 per share with 200 million shares outstanding. This means that Fund A’s holdings collectively are worth $2 billion (after fund expenses are taken into account) while Fund B’s holdings are worth a combined $3 billion. (The fund’s net asset value also includes the value of any capital gains or dividends received by the fund until they are distributed to shareholders. This is why a fund’s NAV typically drops once those distributions are made.)
But the larger point is that it doesn’t really matter what a fund’s share price is, other than for recordkeeping and tax purposes to compute gains and losses. What matters in terms of performance is the change in price on a percentage basis. A fund with a NAV of $5 per share that sees its holdings perform well enough to lift its NAV to $6 per share has effectively provided its investors with a return of 20%. But a fund with a NAV of $20 per share that increases to $21 per share has provided a much lower return of just 5%. Again, it’s not the absolute price of the mutual fund’s shares that matters to investors but rather the percentage change in that price.
Returns and principal invested in stocks are not guaranteed. Investing does not ensure a profitable outcome and always involves risk of loss. The investment return and principal value of mutual funds will fluctuate and shares, when sold, may be worth more or less than their original cost. Mutual funds are sold by prospectus, which can be obtained from your financial professional or the company and which contains complete information, including investment objectives, risks, charges and expenses. Investors should read the prospectus and consider this information carefully before investing or sending money
[/column]
[space height=”1″]
©2013 Morningstar, Inc., 22 W. Washington Street, Chicago, IL 60602.
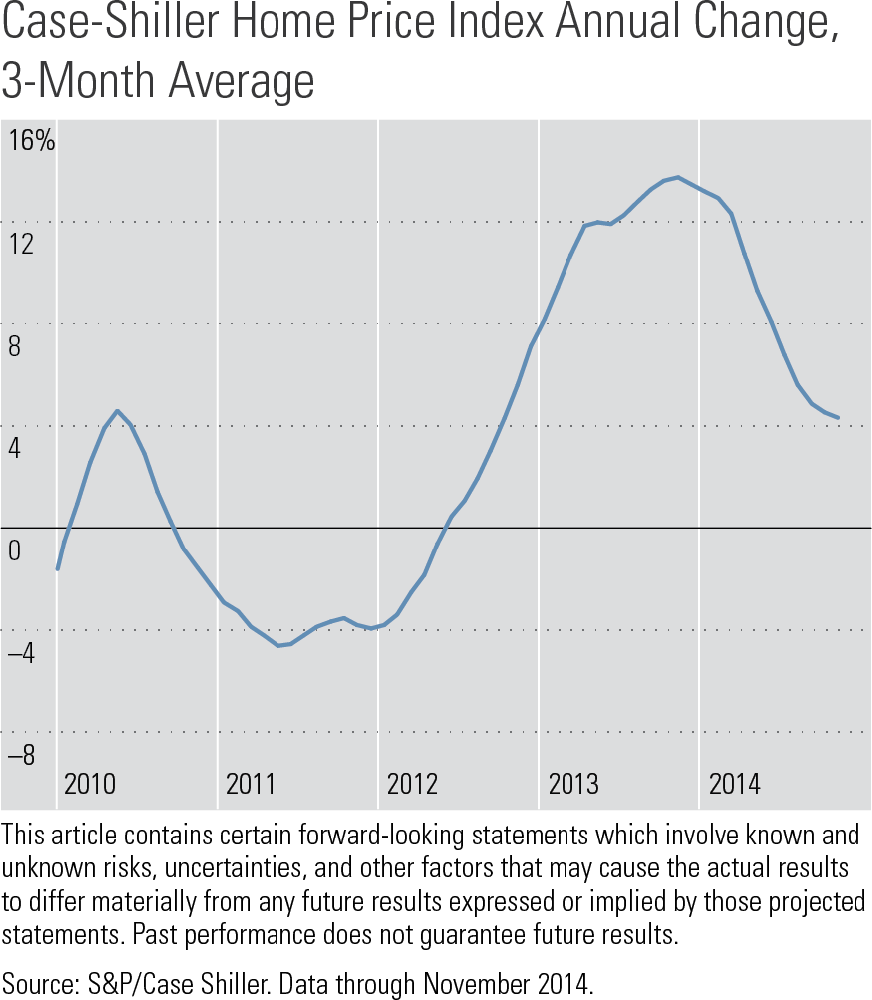
Home Price Growth Returning to a More Sustainable Rate
It is certain that, after a series of fast-paced increases that peaked in late 2013, the rate of home price increases is moderating. As of November, the CaseShiller Index is showing that home prices are growing at 4.3% year-over-year, which is a much slower rate compared to nearly a 14% pace reported in 2013. The prices recovered about 82% of the previous high, and 14 states are currently either above or close to the previous 2006 peak. Nonetheless, Nevada, Florida, Arizona, and a few other states still remain 20% or more below the peak, and it will certainly take many years for those prices to return to their pre-recession level. On the positive side, slower-growing prices are good news for prospective buyers and for the health of the housing market in general, as they should improve housing affordability, providing an essential boost to this so far anemic housing recovery.
[/column][column col=”1/2″]
[space height=”1″]
[/column]
[space height=”1″]
©2013 Morningstar, Inc., 22 W. Washington Street, Chicago, IL 60602.